Storytelling
Cursor
From Static HTML Reports to Interactive Dashboards in Cursor
Problem
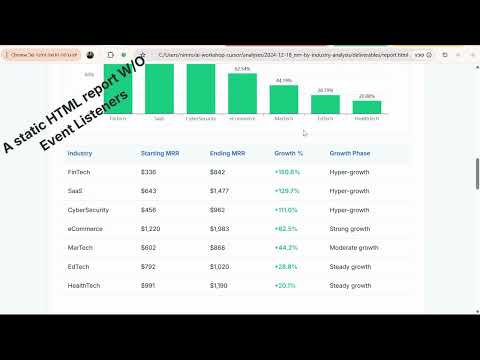
Static HTML reports limit how insights are consumed. 1. Stakeholders see only predefined views of the data 2. Follow up questions require new analyses or additional reports 3. Missing filters, search, and drill down slow decision making 4. Analysts spend time answering ad hoc questions instead of moving forward While HTML reports look polished, they often stop the conversation instead of enabling exploration.
Solution
Add lightweight interactivity to HTML reports directly in Cursor. By introducing filters, search, and JSON based data structures through a single rule, enforcing javascript elements within the HTML, reports become interactive dashboards that allow stakeholders to explore data independently and reduce follow ups.
Prompt
System Instruction: Create a new system rule for an Interactive Data Dashboard

Goal: Transform static data analysis reports into professional, interactive, single-file HTML dashboards.

Core Requirements:

1. Data Interactivity: Implement DataTables.net for all HTML tables to enable instant searching, multi-column sorting, and pagination.

2. Dynamic Visualizations: Use Apache ECharts for all charts. Ensure they are responsive and include tooltips and data zoom features.

3. Modern UI/UX: Use Tailwind CSS for a clean, modern, and branded interface (Sidebar navigation, KPI cards, and white-space optimized layout).

4. Portability: The output must be a single, self-contained HTML file with all JS/CSS included via CDN.

5. Functional Components: - Executive Header: Clear title, date, and status. - KPI Summary Row: Large, clear metric cards at the top. - Table-to-Chart Sync: (Optional) Ability to filter charts based on table selections.

Output Format:
Save this as a .mdc rule that applies whenever I ask for a "deliverable," "dashboard," or "interactive report."
Walkthrough