AI Analytics Directory forTask-based ToolsTask-based Tools
Keep what counts.Discover practical AI solutions, use cases, MCP servers
& platforms for everyday analytics.
AI Analytics Hub is a free directory and comparison platform for data analytics professionals exploring AI-powered tools. The site catalogs MCP (Model Context Protocol) servers that connect AI models to live data sources, conversational analytics platforms that let analysts query data in plain language, and a Tool-per-Task grid matching specific analytics workflows to the best available AI tools. Each listing includes features, pricing, and real-world use cases contributed by the analytics community. The platform is curated by Nimrod Fisher, an AI analytics consultant who runs workshops and consulting for data teams at companies including Remitly, Similarweb, and Bigabid. Companies hire Nimrod to build data agents for analytics teams. He also maintains Data Analytics Skills, a 400+ star open-source Claude skills library (https://github.com/nimrodfisher/data-analytics-skills). New tools, use cases, and weekly updates are added regularly.
Explore by Category
Choose a category to discover the best AI solutions for your needs
Analytics Use Cases
Real-world examples of how AI and connected tools solve common analytics challenges. Each use case includes a practical demonstration you can follow.
Problem
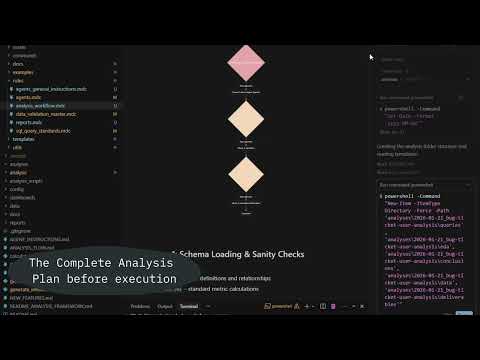
As AI becomes more involved in data workflows, mistakes become harder to trace. Without full visibility into assumptions, queries, intermediate data, and decisions, teams lose control and risk costly data errors.
Solution
Adopt a transparency first framework across the entire analytics workflow. By documenting the business question, execution steps, queries, intermediate datasets, and final outputs, teams gain full traceability and validation at every stage. This mindset, independent of tools, reduces risk, increases trust, and keeps analysts in control of AI driven processes.
Problem
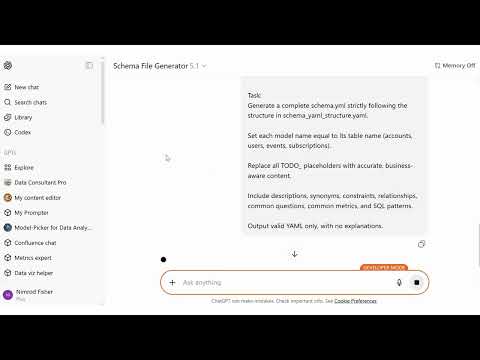
Manually documenting tables, columns, and business logic is slow and inconsistent. Missing or outdated metadata reduces LLM accuracy and trust in analytics outputs.
Solution
Use a YAML template and a custom GPT to auto-generate a full schema.yml from context, lineage, and table definitions. All placeholders are filled with clear, consistent metadata—making the warehouse instantly LLM-ready.
How AI Expands Analyst Capabilities to Detect Churn Earlier
Problem
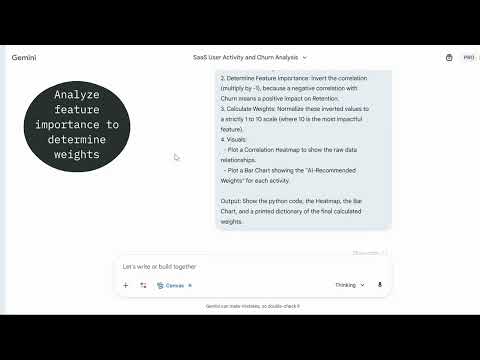
Churn analysis is usually slow, manual, and backward-looking. Analysts work with many disconnected usage metrics, spend significant time on EDA and correlation analysis, and still struggle to produce an early, explainable churn signal that business teams can act on. As a result, churn is identified too late and insights are hard to operationalize.
Solution
Use AI to augment analyst capabilities and accelerate churn signal design. By aggregating meaningful user actions, using AI assisted EDA and correlation analysis, and systematically deriving weights, analysts can quickly build an explainable engagement based metric that serves as an early churn indicator. This enables faster iteration, clearer decision making, and a shift from reactive churn analysis to proactive churn prevention.
Explaining WHY questions with an AI Powered Metrics Tree
Problem
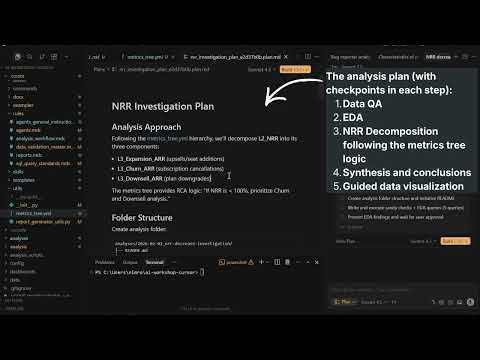
Teams can see when key metrics like NRR or ARR change, but struggle to explain why. Analysis often stops at surface level trends, with no structured way to connect high level business metrics to the underlying drivers.
Solution
Use a metrics tree to move from what happened to why it happened. By defining metric hierarchies, semantic context, and calculations in version controlled YAML files, AI can generate structured analysis plans that follow the metric relationships instead of guessing. This enables consistent, explainable root cause analysis tied directly to business metrics.
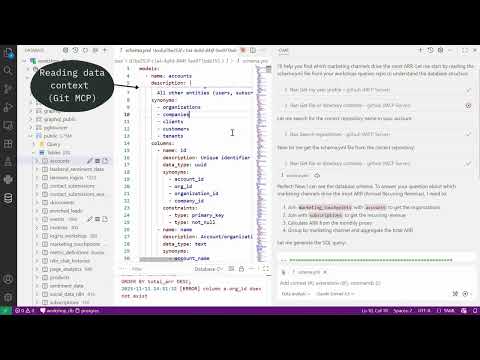
Data-Context Chat Mode for Faster Analysis
Problem
Analysts lose hours because chat-based tools don’t know the data. Prompts miss table context, synonyms, and relationships. Queries get rewritten repeatedly. Results aren’t explainable. The analysis loop stalls: fetch schema manually, guess joins, rerun, copy to notebooks, summarize by hand.
Solution
A dedicated “Data Analysis” chat mode in VS Code that is context-aware by design. It auto-reads schema.yml (tables, columns, glossary, relationships), samples distributions to learn the data’s shape, then generates explainable SQL, runs it, and summarizes results in one place.
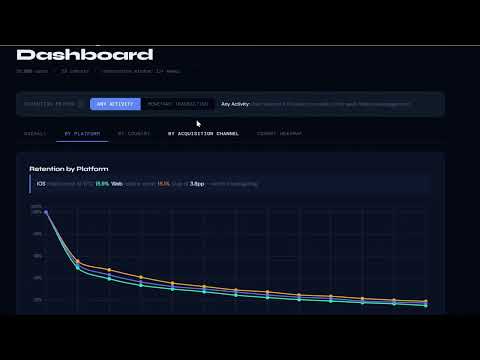
Automating Cohort Retention Analysis with a Reusable Skill
Problem
Teams often suspect early user drop off but lack a structured, repeatable way to measure it. Manual cohort analysis is time consuming, inconsistent, and difficult to standardize across product, marketing, and finance teams.
Solution
Use a Cohort Analysis skill built on an Access, Compute, Present framework. The skill transforms user level data into deterministic cohort calculations, aggregates weekly retention across selected dimensions, and generates a consistent interactive HTML output. By embedding semantic validation and process documentation, teams gain faster insights into where drop off occurs and when retention stabilizes, without rebuilding the logic each time.
Problem
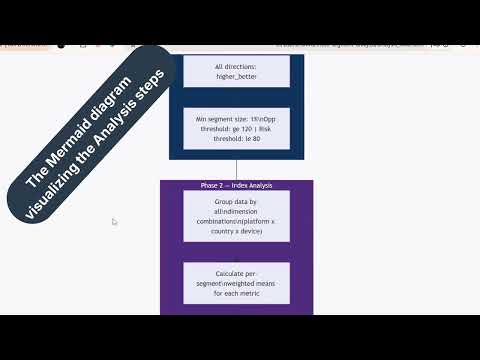
Most dashboards analyze performance across single dimensions such as device, country, or lifecycle stage. However, real opportunities and risks often emerge from combinations of segments, which are difficult to identify manually due to the explosion of possible combinations and KPIs to compare.
Solution
Use a Multi Segment Opportunity Finder skill to automate combination analysis. The skill generates multi dimensional segment combinations, validates the selected KPI, calculates index scores against the overall population, and highlights overperforming and underperforming segments. This enables faster identification of high value opportunities and hidden risks with minimal additional analysis effort.

Environment Aware Query Optimization in Cursor
Problem
As query volume and data size grow, generic SQL generated by Cursor becomes inefficient. Without awareness of the specific DWH environment, queries may ignore platform specific best practices, leading to slower performance and higher costs.
Solution
Force Cursor to optimize queries based on your actual data warehouse. By injecting up to date documentation into the context and using it to create rules, Cursor generates and improves queries according to environment specific best practices, enabling faster, cheaper, and more reliable query execution.
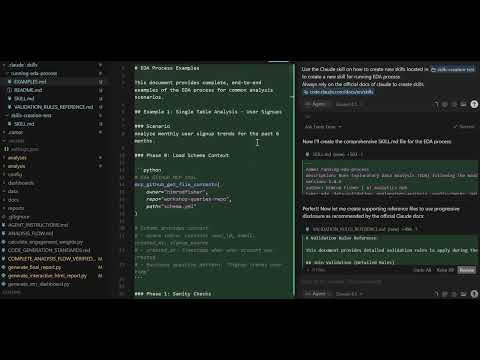
Building skills in Cursor for efficient capabilites usage
Problem
Creating reusable AI behaviors in Cursor often depends on dedicated tools or licenses. Without access to Claude Skills, teams may rely on rules or repeated prompts, which leads to higher token usage, manual activation, and harder to scale workflows.
Solution
Use Cursor to generate Skills directly from Anthropic documentation. By having Cursor build Skills based on official guidelines, it is possible to create task specific behaviors such as EDA, query optimization, or text analysis without a Claude license. Skills activate only when relevant, reduce prompt overhead, and scale better than project wide rules.
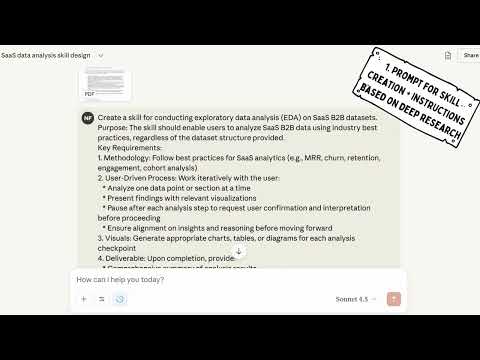
Using Skills to create instructions for an EDA Agent
Problem
EDA steps are often ad-hoc and inconsistent. Analysts lose time rewriting prompts and hand-holding tools. Instructions don’t transfer cleanly across platforms or agents.
Solution
Use Claude Skills to generate a structured EDA instruction set—clear tasks, inputs, checks, and outputs. Package it once, run EDA reliably, and feed the same instructions to agents on any platform.
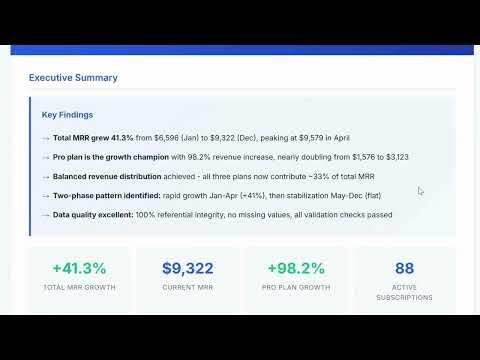
Standardizing HTML Analytics Reports in Cursor with Claude
Problem
HTML reports are a common output of analytics workflows in Cursor, but their quality is inconsistent. 1. Each analysis ends with a different structure, layout, and visual style 2. There is no unified theme, branding, or formatting standard 3. Reports look different across analysts, projects, and runs 4. This reduces trust, readability, and the perceived quality of analytics outputs, both internally and for clients The core issue is the lack of a reusable, enforceable reporting standard inside the analysis workflow.
Solution
Leverage a Claude based HTML reporting skill inside Cursor to standardize outputs. By defining a fixed HTML structure, visual style, and branding rules once, and reusing them across analyses, every report is generated in the same format. Only the data and analysis steps change. The result is repeatable, professional grade analytics reporting without manual formatting overhead.
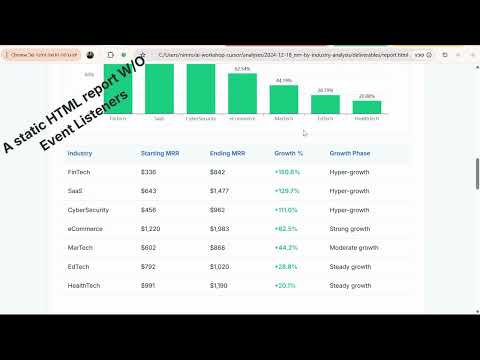
From Static HTML Reports to Interactive Dashboards in Cursor
Problem
Static HTML reports limit how insights are consumed. 1. Stakeholders see only predefined views of the data 2. Follow up questions require new analyses or additional reports 3. Missing filters, search, and drill down slow decision making 4. Analysts spend time answering ad hoc questions instead of moving forward While HTML reports look polished, they often stop the conversation instead of enabling exploration.
Solution
Add lightweight interactivity to HTML reports directly in Cursor. By introducing filters, search, and JSON based data structures through a single rule, enforcing javascript elements within the HTML, reports become interactive dashboards that allow stakeholders to explore data independently and reduce follow ups.
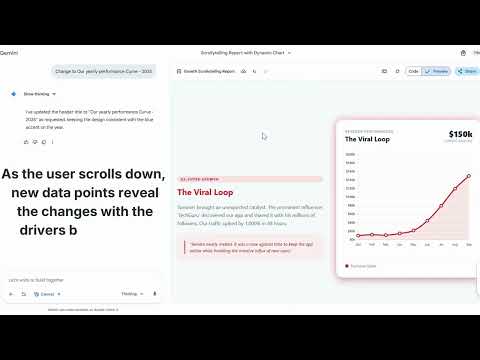
Make Static Charts Insightful with Scrollytelling
Problem
Traditional dashboards focus on exploration, not explanation. Stakeholders often ask for raw exports or additional breakdowns, while the core story and insights get lost among charts. As a result, dashboards become collections of visuals instead of decision driven narratives.
Solution
Use scrollytelling to transform dashboards into contextual data stories. By combining HTML reports with scroll triggered chart updates, teams can guide attention, add narrative context, and highlight key insights step by step. These patterns can be reverse engineered into reusable templates and embedded into Cursor workflows. The outcome is a shift from delivering data to delivering understanding and actionable insights.
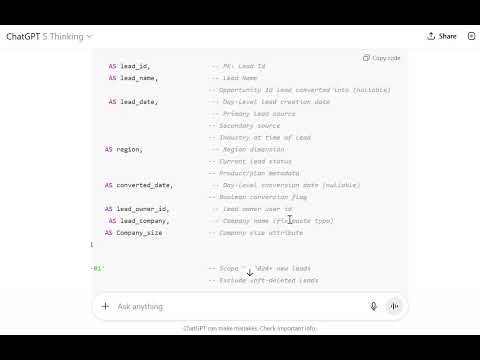
Make SQL Readable to Humans and AI
Problem
Analysts rewrite opaque SQL. LLMs misinterpret messy patterns and guess joins.
Solution
Enforce a compact style guide: consistent CTE blocks, semantic column aliases, section headers, and plain-English notes. Queries become self-explanatory and machine-parsable.

Inject Business Context from Confluence via MCP
Problem
Analysts and LLMs lack definitions, owners, and links scattered across Confluence, so answers drift and reviews stall.
Solution
Connect a Confluence MCP server so the chat agent can read pages, metric definitions, dashboards, and runbooks on demand. Prompts become contextual and outputs consistent.
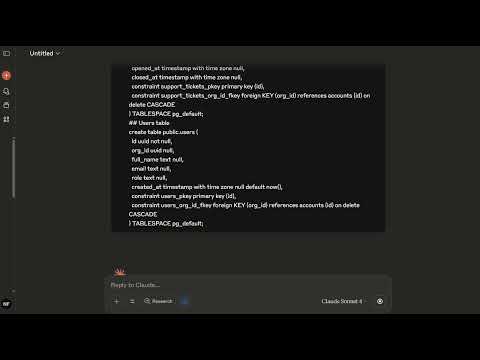
Visualize table relationships with LLM
Problem
Understanding data relationships is challenging and usually requires dedicated platforms
Solution
LLMs can use simple CREATE TABLE statements to understand relationships and generate an ERD diagram
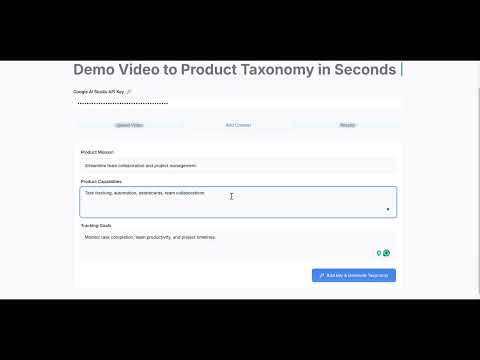
Problem
Product event taxonomy is slow to build, requires manual grouping and naming, and often lacks consistency. Analysts need a faster, structured approach without engineering support.
Solution
A no code app uses Google AI Studio API to auto group events, suggest category structure and unified naming, then export a ready to use taxonomy for analytics tools, cutting classification time from days to minutes. https://www.easyventor.diy/
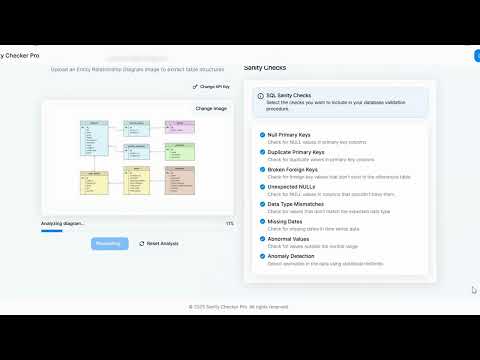
Problem
Creating SQL procedures for custom sanity checks is repetitive and slow. Analysts spend hours writing boilerplate checks for every new schema or environment.
Solution
A no code app uses AI to convert selected tables or ERD schema into a SQL procedure of sanity checks customized to the user's environment, removing manual scripting work.

Problem
Analysts invest hours building deep data decks in Google Workspace, but the result is static and hard to consume. Stakeholders skim the slides instead of really absorbing the story in the numbers.
Solution
Summarize the analysis into LLM-friendly Markdown bullets, use NotebookLM to turn them into infographics, and then use Gemini Veo3 to generate a dynamic video so the key metrics and narrative come to life.