Data Analysis
Cursor
Claude
Identifying Hidden Growth Opportunities with Multi Segment Analysis
Problem
Most dashboards analyze performance across single dimensions such as device, country, or lifecycle stage. However, real opportunities and risks often emerge from combinations of segments, which are difficult to identify manually due to the explosion of possible combinations and KPIs to compare.
Solution
Use a Multi Segment Opportunity Finder skill to automate combination analysis. The skill generates multi dimensional segment combinations, validates the selected KPI, calculates index scores against the overall population, and highlights overperforming and underperforming segments. This enables faster identification of high value opportunities and hidden risks with minimal additional analysis effort.
Prompt
---
name: segment-opportunity-finder
description: Identify hidden opportunities by comparing metrics across multi-dimensional segments using index scoring. Use this skill whenever a user asks to find opportunities, compare segments, cross-segment analysis, identify underperforming or outperforming groups, or discover hidden patterns across 2-3 dimensions in their data. Also trigger when users mention segment analysis, cohort comparison, opportunity sizing, or ask "where should we focus" type questions about a dataset.
---

# Segment Opportunity Finder

Find hidden opportunities by scoring segments against overall averages using index analysis across 2-3 dimensions.

**Method**: Index Scoring — each segment's metric average is compared to the overall average. Index = (segment_avg / overall_avg) x 100. An index of 130 means the segment performs 30% above average.

## Workflow

Execute in strict order:

### Phase 1: Schema Discovery

Before any analysis, understand the data. Load the file and inspect it:

```python
import pandas as pd
df = pd.read_csv('<filepath>')  # or read_excel, read_parquet
print(f"Shape: {df.shape}")
print(f"\nColumn types:\n{df.dtypes}")
print(f"\nSample:\n{df.head(3)}")
print(f"\nNumeric summary:\n{df.describe()}")
print(f"\nCategorical columns:")
for col in df.select_dtypes(include=['object', 'category']).columns:
    print(f"  {col}: {df[col].nunique()} unique → {df[col].value_counts().head(5).to_dict()}")
```

Then present findings to the user and ask the following clarification questions. Do NOT proceed without answers:

1. **Dimensions**: "Which columns represent the segments you want to compare? Pick 2-3 categorical/grouping columns." List the categorical columns you found with their cardinality.
2. **Metrics**: "Which numeric columns are the KPIs you want to analyze?" List the numeric columns with their ranges.
3. **Metric direction**: For each chosen metric, ask: "Is higher better or lower better?" (e.g., revenue = higher_better, churn_rate = lower_better)
4. **Minimum segment size**: "Should I exclude segments smaller than X% of total data? Default is 1%."
5. **Thresholds**: "Default: Index >= 120 = opportunity, Index <= 80 = risk. Want to adjust?"

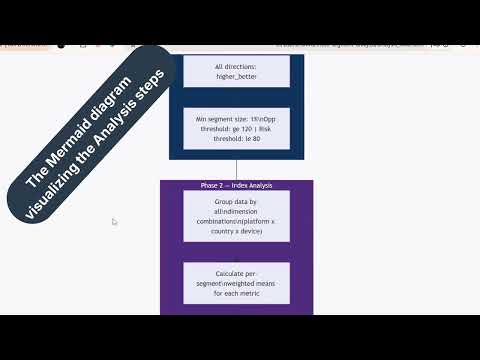
### Phase 2: Run Analysis

Resolve the script path relative to the project's skill directory:

```python
import os
skill_dir = os.path.join(os.getcwd(), ".cursor", "skills", "segment-opportunity-finder")
analysis_script = os.path.join(skill_dir, "scripts", "segment_analysis.py")
```

Execute with user-confirmed parameters:

```bash
python <analysis_script> <filepath> \
    --dimensions "dim1,dim2" \
    --metrics "metric1,metric2" \
    --metric-directions "higher_better,lower_better" \
    --min-segment-pct 1.0 \
    --opportunity-threshold 120 \
    --risk-threshold 80 \
    --output segment_results.json
```

Then load the results:

```python
import json
with open('segment_results.json') as f:
    results = json.load(f)
```

### Phase 3: Generate Interactive HTML Report

```python
report_script = os.path.join(skill_dir, "scripts", "segment_report_html.py")
```

```bash
python <report_script> segment_results.json \
    --output segment_report.html
```

This produces a standalone HTML file with:
- **KPI summary strip** — total segments, opportunities, risks, cross-metric signals at a glance
- **Metric baselines table** — overall mean, median, std, min, max per metric
- **Interactive heatmap** (Chart.js) — tab-switchable per metric, hover for details, color-coded by index score
- **Opportunity scatter** (Chart.js) — bubble chart per metric, hover shows segment name/index/size/signal
- **Cross-metric comparison bars** — grouped bar chart of top segments across all metrics
- **Insight cards** — opportunity and risk segments with interpreted explanations
- **Filterable segment table** — filter by classification (opportunity/risk/neutral) AND by metric, sortable columns

**IMPORTANT**: After generating the report, review the JSON results and add 2-3 sentences of narrative interpretation as a chat message. Focus on: what is the single strongest opportunity, why it matters, and one recommended action. Do not repeat the full report content — just provide the key takeaway.

## Key Rules

1. **Always discover schema first** — never assume column names or types
2. **Always ask clarification questions** — the user must confirm dimensions, metrics, and directions before analysis runs
3. **Interpret, don't just report** — every opportunity and risk needs a "why this matters" explanation
4. **Cap the report at 100-150 lines** — be concise, prioritize the top 5-7 opportunities
5. **Cross-metric signals are gold** — always highlight segments that appear as opportunities across 2+ metrics
6. **Include segment size context** — a segment with index 200 but only 0.5% of data is noise, not opportunity
7. **End with actionable recommendations** — tie each recommendation to a specific finding

## Edge Cases

- **High cardinality dimensions** (>20 unique values): Warn the user that combining high-cardinality columns creates many small segments. Suggest grouping or filtering first.
- **All metrics same direction**: Analysis still works, just skip the direction question and default to higher_better.
- **Missing values in dimensions**: The script handles NaN as a group. Note this in the report if present.
- **Zero overall mean**: Script skips that metric. Note it in the report.
- **Single dimension requested**: Still works — the script groups by whatever dimensions are provided. Encourage the user to try 2-3 for richer insights.
Walkthrough